
ShopperTrak Trends - April 2019
April 2019 Wrap-up

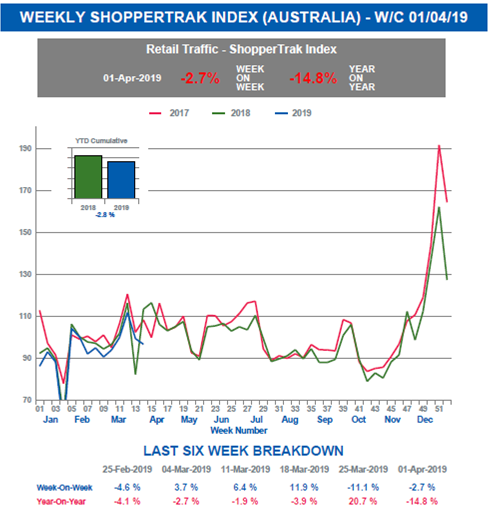
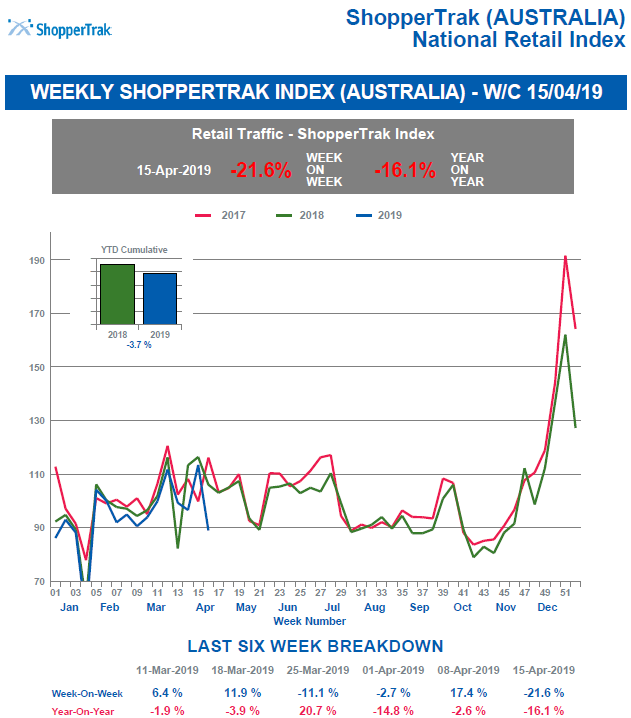
In the week before Easter, the National Index was down 21.6% from the previous week and down 16.1% compared to this time last year.
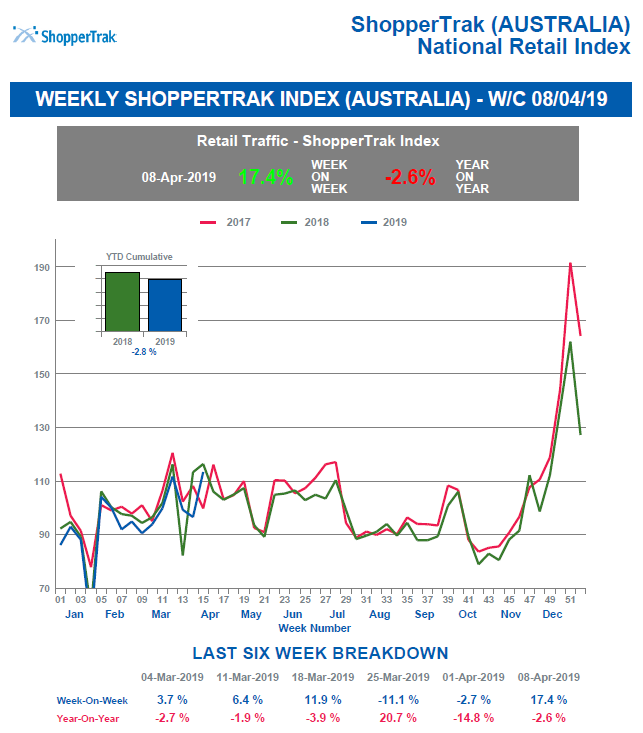
In the preceeding week, retail traffic was up 17.4% compared to the week prior and down 2.6% compared to the same time last year.
Today’s retailers need to make the most out of in-store traffic – but from an operations perspective the question is how?
If you think about your retail TRAFFIC DATA and analytics as a simple dashboard, it has 3 dials that INFLUENCE each other:
- TRAFFIC
- CONVERSION
- AVERAGE TRANSACTION SIZE
With these 3 metrics it’s possible to calculate ‘Sales Per Shopper’ and ‘Shopper-to-Associate-Ratio’
- Now that you have these metrics, what do you do with them?
- Improve the shopper experience
- Drive store productivity
- Improve staff scheduling & store productivity
- Drive basket growth through a consultative sales approach
- Optimize existing store footprint
- Align marketing initiatives with operations
Looking back at March.
Retail traffic was down 11.1% in the last week of March (finishing 30 March) from the week before and up 20.7% from this week last year. This week last year fell in the Easter holiday period.
Consumer confidence and retail traffic was predicted to be lower with the federal budget upon us, however we now know that retail enjoyed a boon 24 hours following key announcements in the Federal Budget, along with ABS figures showing that the sector broke free of its shackles in February (Read related story)
In the week commencing 18th March, there was a 6.4% increase in traffic from the previous week and only down 1.9% from this time last year.
See the week by week reports for April 2019 below:
The Australian Retail Index is published by ShopperTrak and is an established benchmark of visitor numbers to retail stores, compiled from an anonymous sample in a specific sector or region. www.shoppertrak.com